
Home .
Testing Capabilities .
Research .
Downloads .
Contacts .
Links
Foundations Health Monitoring
FHWA Sponsored Research / Development
Project Overview
In order to develop safer, more cost-effective and reliable structures for the future, it is
imperative to cross-check the assumptions made during the design phase with the conditions
experienced by the structure. Ideally, the designer’s understanding of those conditions is
reflected in the design and that the response of the structure to such loads shows close
agreement. In many cases, however, the worst case scenarios controlling the design do not
actually occur; therein, the true structural design is never fully verified. This is not to state that
the design is unreasonable, but rather the response to extreme loads remains somewhat
hypothetical. In the instances where extreme events due occur, rarely is there quantify-able
measures of how the structure performed due to the absence of permanently installed/embedded
instrumentation along with a continuously sampling acquisition methodology. More common /
less critical loading states can and have been used to provide insight into the response that can be
either extrapolated or used to provide a lesser degree of verification. But this type of post
construction verification is not commonplace.
Civil engineering applications are typically the last to adopt and/or receive the inroads into
newer technological breakthroughs that are used in other arenas of science. Like that of personal
computers industry, advances in wireless microwave and satellite communications are occurring
daily by leaps and bounds. Even some of yesterday’s technology have not yet been fully
implemented or even explored with the exception of atypical high profile structures (for instance
in high risk seismic regions). The upshot is that many of yesterday’s technologies are now
relatively inexpensive and can be reasonably applied to civil type structures more routinely.
It is the intent of this program to explore several alternatives for implementing low cost remote
sensing of embedded foundation devices in order to identify normal and extreme occurrences
(i.e. long-term corrosion or stress monitoring, peak movement or stress detection, etc.). Further
applications might include conducting and/or monitoring load tests from remote locations or
simply monitoring foundation response due to construction loads.
The locales that are influenced by this project are without bounds but may restrict the type of
system that can be applied. The technologies range from local wi-fi systems which imply an
urban setting to satellite systems that can work any where in the world. This project is focused on introducing more robust yet inexpensive means to monitor foundation performance reliably.
Task 1. Evaluate on-going field measurement programs
Task 2. Review and secure a data acquisition system
Task 3. Establish a upload site for remote review of testing
Task 4. Perform basic lab-type testing to verify complete system
Task 5. Perform field testing (long-term and/or transient)
Task 6. Provide overviews of system suitability.
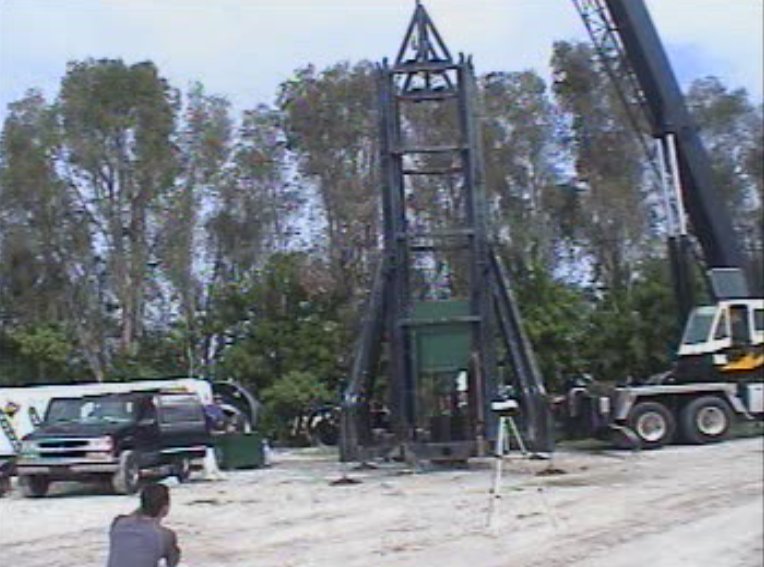
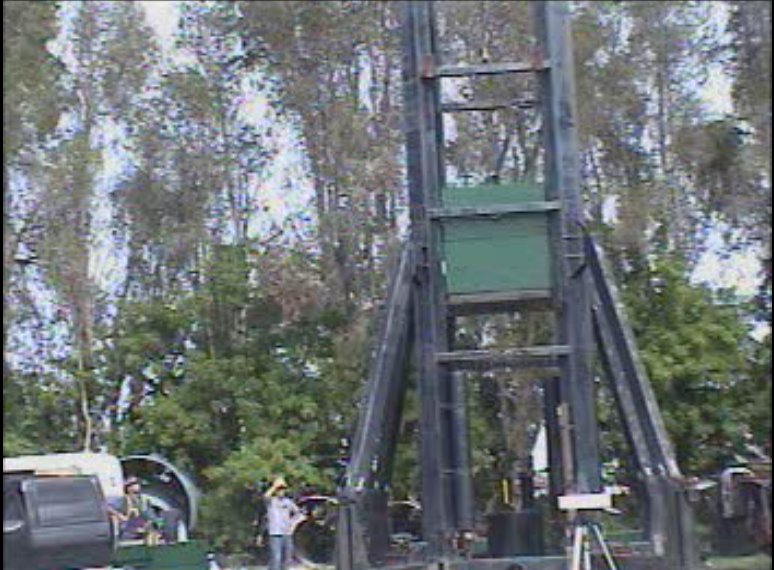
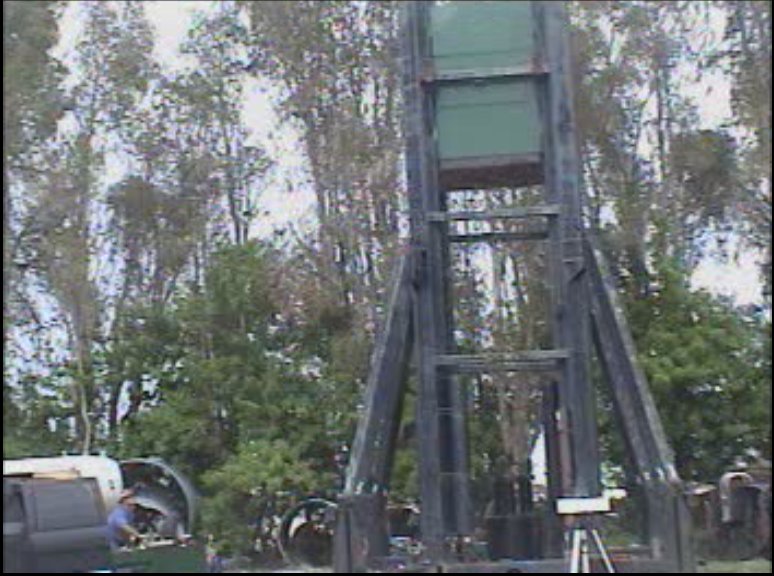
TASK 1: On-going Field Mearsurement Programs
The Clearwater drilled shaft test site was originally equipped with a post grouting cell for future
research such as this program. The shafts were instrumented with the embedded strain gages and thermocouples which
provided a good opportunity to test the proposed system. As such, Rapid Load testing was performmed on the shaft were a web-cam
was utilized to allow real-time viewing of the testing. Below are the archived videos:
Rapid Load Test WebCam (DISABLED)
 RLT Testing: 5ft Drop, 2 Mass System RLT Testing: 5ft Drop, 2 Mass System
|  RLT Testing: 10ft Drop, 2 Mass System RLT Testing: 10ft Drop, 2 Mass System
|  RLT Testing: 15ft Drop, 3 Mass System RLT Testing: 15ft Drop, 3 Mass System
TASK 2: Review and Secure a Data Acquisition System
This aspect of the project simply involved purchasing an economical data collection
system capable of transmitting the data wirelessly to a host server at the university.
An on-going Florida Department of Transportation project was chosen to serve for the sample data
collection program. This mutually benefitted both projects.
The entire remote monitoring system is made of a number of parts: A
Campbell Scientific CR1000 data logger, an AM25T 25-channel multiplexer, a Raven100
CDMA AirLink Cellular Modem, PS100 12V power supply and 7Ahr rechargeable
battery, a 12W Solar Cell panel from Unidata, and a large environmental enclosure to
protect all the materials from the elements. The total cost of
the system, including all equipment and ongoing services was approximately $4,500. The
TC wires were connected to the multiplexer as there were not enough channels on the
CR1000 to read all of the TCs. The multiplexer was then connected to the CR1000. Loggernet, the data collection software, was pre-installed into the CR1000
and set-up to monitor the system. The data collection system was equipped with the solar
panel to help sustain the battery voltage (Figure 3-23). The system was programmed to
wake up every 15 minutes, take a temperature reading and record it, and then go back to
sleep. The Raven modem was programmed to wake up once every 60 minutes and
transmit the collected data back to the host computer, which was stationed in the
Geotechnical Research Department at USF, where the data could be processed. Due to
the high number of TCs that were being monitored, two TCs were not attached to the
remote monitoring system. The TCs that were located at 1D and 2Ds away from the shaft
were attached to an OMEGA OM-220 data logger that collected data at the same rate as
the CR1000, however the data was simply stored and a site visit was required to collect
that data. The battery voltage was also monitored and sent to the host computer along
with the thermal data so that the power consumption could be tracked.
TASK 3: Database of Tests
The FHWA data base for deep foundations (originally housed at the Turner-Fairbanks Research Center)
has undergone several transitions and at present
is not accessible for researchers. This task was charged with providing a possible portal
for future test data to be uploaded and/or downloaded as needed by researchers worldwide.
Upload Data
Access Data
TASK 4: Perform basic lab verification of equipment
Task 4 was really an extension of Task 2. To this end, the equipment chosen for the project
was setup in the lab with various instruments, the cellular modem was configured, and basic
communications with the host server were established. Automated data interpretation followed
once a data file format was established.
Webcam sites were added to the project webpage to allow interested parties from both FDOT and
FHWA to look on while construction and testing activites were underway. These sites were tested
prior to commencement of Task 5.
TASK 5: Remote Sensing Site
In cooperation with the FDOT project "Attenuating Mass Concrete Effects in Drilled Shafts," this task
monitored the hydration-induced temperature changes in a 9 ft diameter cast-in-place concrete foundation
at various locations. This foundation was unique given the central most concrete was intentionally left
out via central formwork (approx 48" diameter steel casing). The focus of the FDOT study was to show both
cost savings from using less concrete while also controlling core concrete temperature during the curing
phase.
Attenuating Mass Concrete Effects in Drilled Shafts Project
I-35W St. Anthony Falls Bridge Project
Example Data Sets from Remote Sensing Sites
"Green" RLT Test Results
Thermocouple Data
Thermal Integrity Test Data for Tube 5 at 6AM
Thermal Integrity Test Data for Soil Tube 1/2-Diameter at 6AM
Data Logger Battery Voltage
TASK 6: Provide Overview of System Suitability
Overall the system worked extremely well. At one point during the monitoring
period, there was a cellular timeout and the modem stopped transmitting the data to the
host computer. This was fixed by a site visit to reset the modem and the problem did not
occur again. However the main problem that was encountered was an issue with power
usage. At the beginning of the monitoring procedure, the Raven modem was left on and
would send back its data every hour. However this used an extremely large amount of
power and the system lost power after just a few hours. The monitoring
procedure was revised so that the modem would go to sleep and only wake up once every
hour to transmit the collected data. Even with this alteration, the battery was still losing
an ongoing battle with the power consumption of the Raven modem. Once the battery
voltage dropped below 11.6V, the data collection system has approximately 8 hours of
life before it quits. Due to this large amount of power usage, three site visits were
required to get to the system and recharge the battery. These three visits can clearly be
seen in the plot of the battery voltage over time. In order to provide a
completely remote unit, a larger solar cell is recommended/required as the 12W did not
gain enough power to make the system fully remote.
Originally, the data collection period was supposed to last until it was seen that
the temperatures in the shaft had reached somewhat equilibrium. However, in reviewing
the data, the temperatures recorded from the soil surrounding the shaft were increasing
while the temperatures within the shaft had reached equilibrium. Therefore
data collection was continued as a result. The data was collected for another period of
time until it was determined that the temperatures both in the shaft and in the surrounding
soil had reached equilibrium. From the final temperature plot, it can be seen that the
temperature in the soil at 1D away from the shaft was the last to eventually reach
equilibrium. It can also be seen that the temperature in the soil at 2Ds away from the shaft
was affected only slightly by the immense heat coming from the shaft.
Contact Us
If you have questions or comments regarding Foundations Health Monitoring, please contact Gray Mullins at gmullins@eng.usf.edu.
|